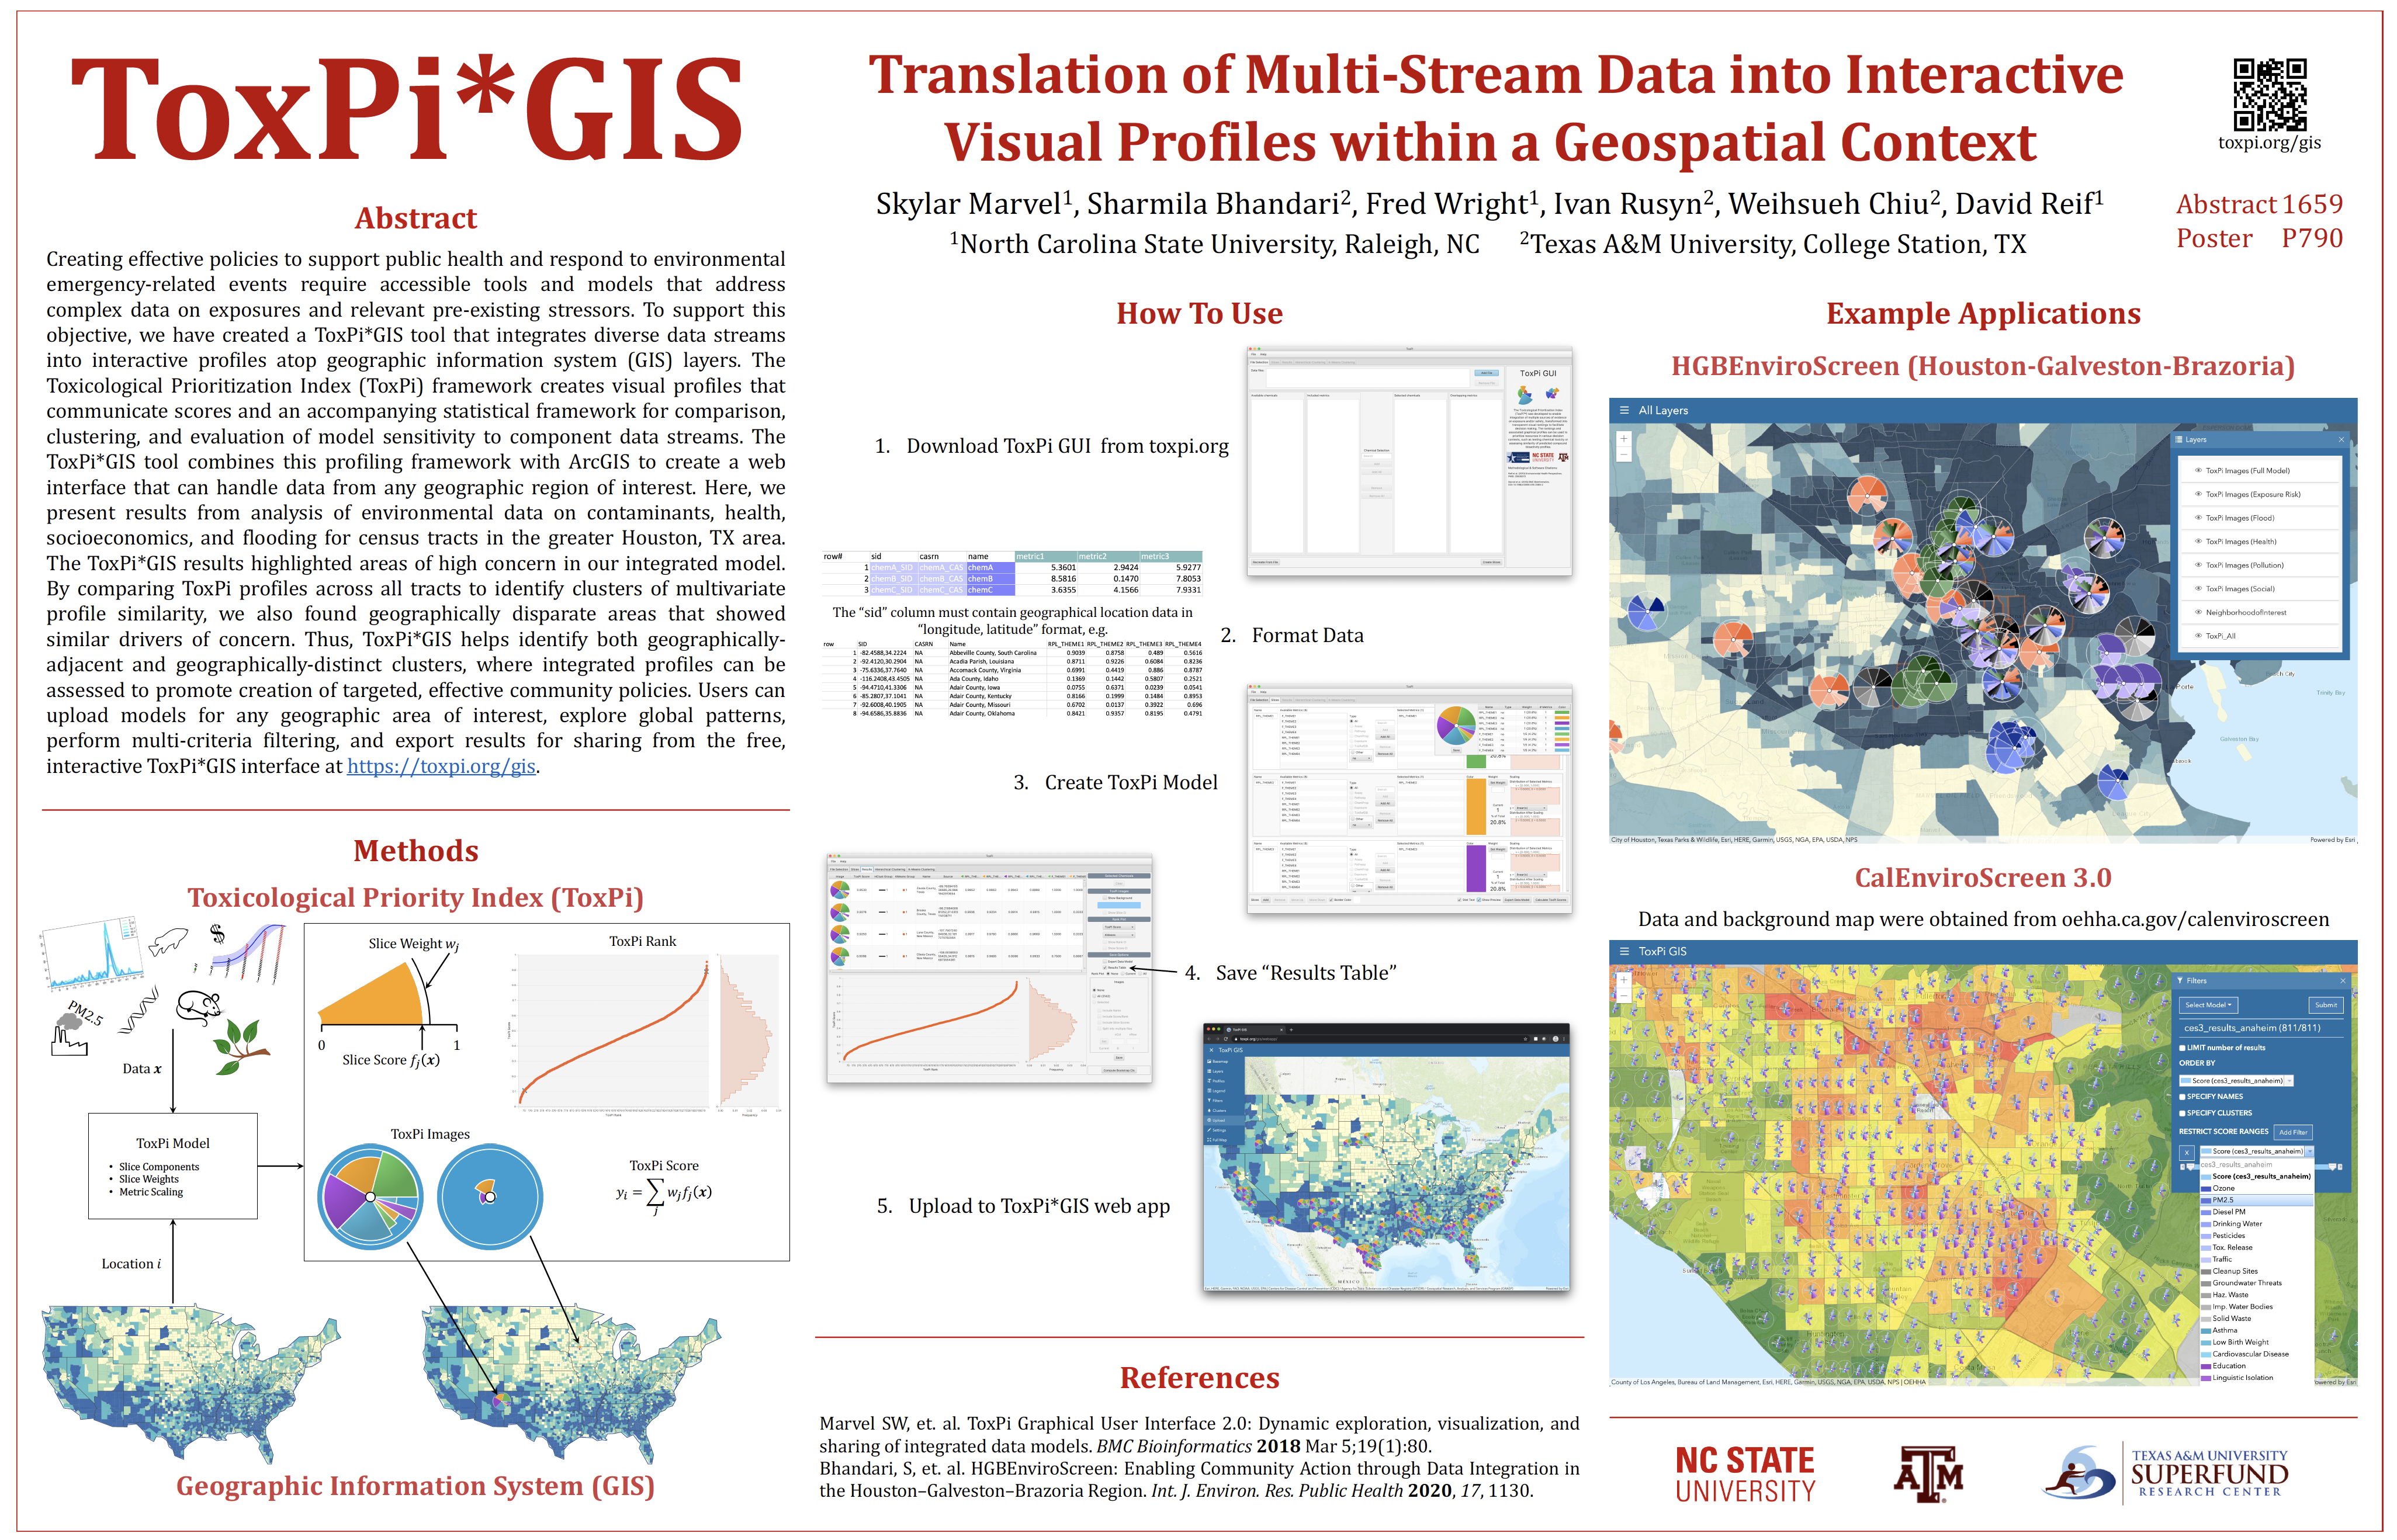
Creating effective policies to support public health and respond to environmental emergency-related events requires accessible tools and models that address complex data on exposures and relevant pre-existing stressors. To support this objective, we have created a ToxPi*GIS tool that integrates diverse data streams into interactive profiles atop geographic information system (GIS) layers. The Toxicological Prioritization Index (ToxPi) framework creates visual profiles that communicate scores and an accompanying statistical framework for comparison, clustering, and evaluation of model sensitivity to component data streams. The ToxPi*GIS tool combines this profiling framework with ArcGIS to create a web interface that can handle data from any geographic region of interest.
Data could come from environmental monitors, epidemiological surveys, health status, clinical data, socioeconomics, or any source that can be tied to an arbitrary geographic region (e.g. census tract, postal code, county, state, or country). The ToxPi*GIS results highlight areas of high concern in an integrated model. ToxPi*GIS can also be used to identify clusters of multivariate profile similarity, regardless of geographic contiguity.
The integrated profiles can be assessed to promote creation of targeted, effective community policies. Users can upload models for any geographic area of interest, explore global patterns, perform multi-criteria filtering/clustering, and export results for sharing from the free, interactive ToxPi*GIS interface (web application) at https://toxpi.org/gis/webapp
 Marvel, Bhandari, Wright, Rusyn, Chiu, and Reif. ToxPi*GIS: Translation of multi-stream data into interactive visual profiles within a geospatial context. Society of Toxicology Annual Meeting, 2020
Data could come from environmental monitors, epidemiological surveys, health status, clinical data, socioeconomics, or any source that can be tied to an arbitrary geographic region (e.g. census tract, postal code, county, state, or country). The ToxPi*GIS results highlight areas of high concern in an integrated model. ToxPi*GIS can also be used to identify clusters of multivariate profile similarity, regardless of geographic contiguity.
The integrated profiles can be assessed to promote creation of targeted, effective community policies. Users can upload models for any geographic area of interest, explore global patterns, perform multi-criteria filtering/clustering, and export results for sharing from the free, interactive ToxPi*GIS interface (web application) at https://toxpi.org/gis/webapp
Marvel, Bhandari, Wright, Rusyn, Chiu, and Reif. ToxPi*GIS: Translation of multi-stream data into interactive visual profiles within a geospatial context. Society of Toxicology Annual Meeting, 2020