Tutorial menu
Overlay ToxPi*GIS model (CalEnviroScreen example)Create custom ToxPi model
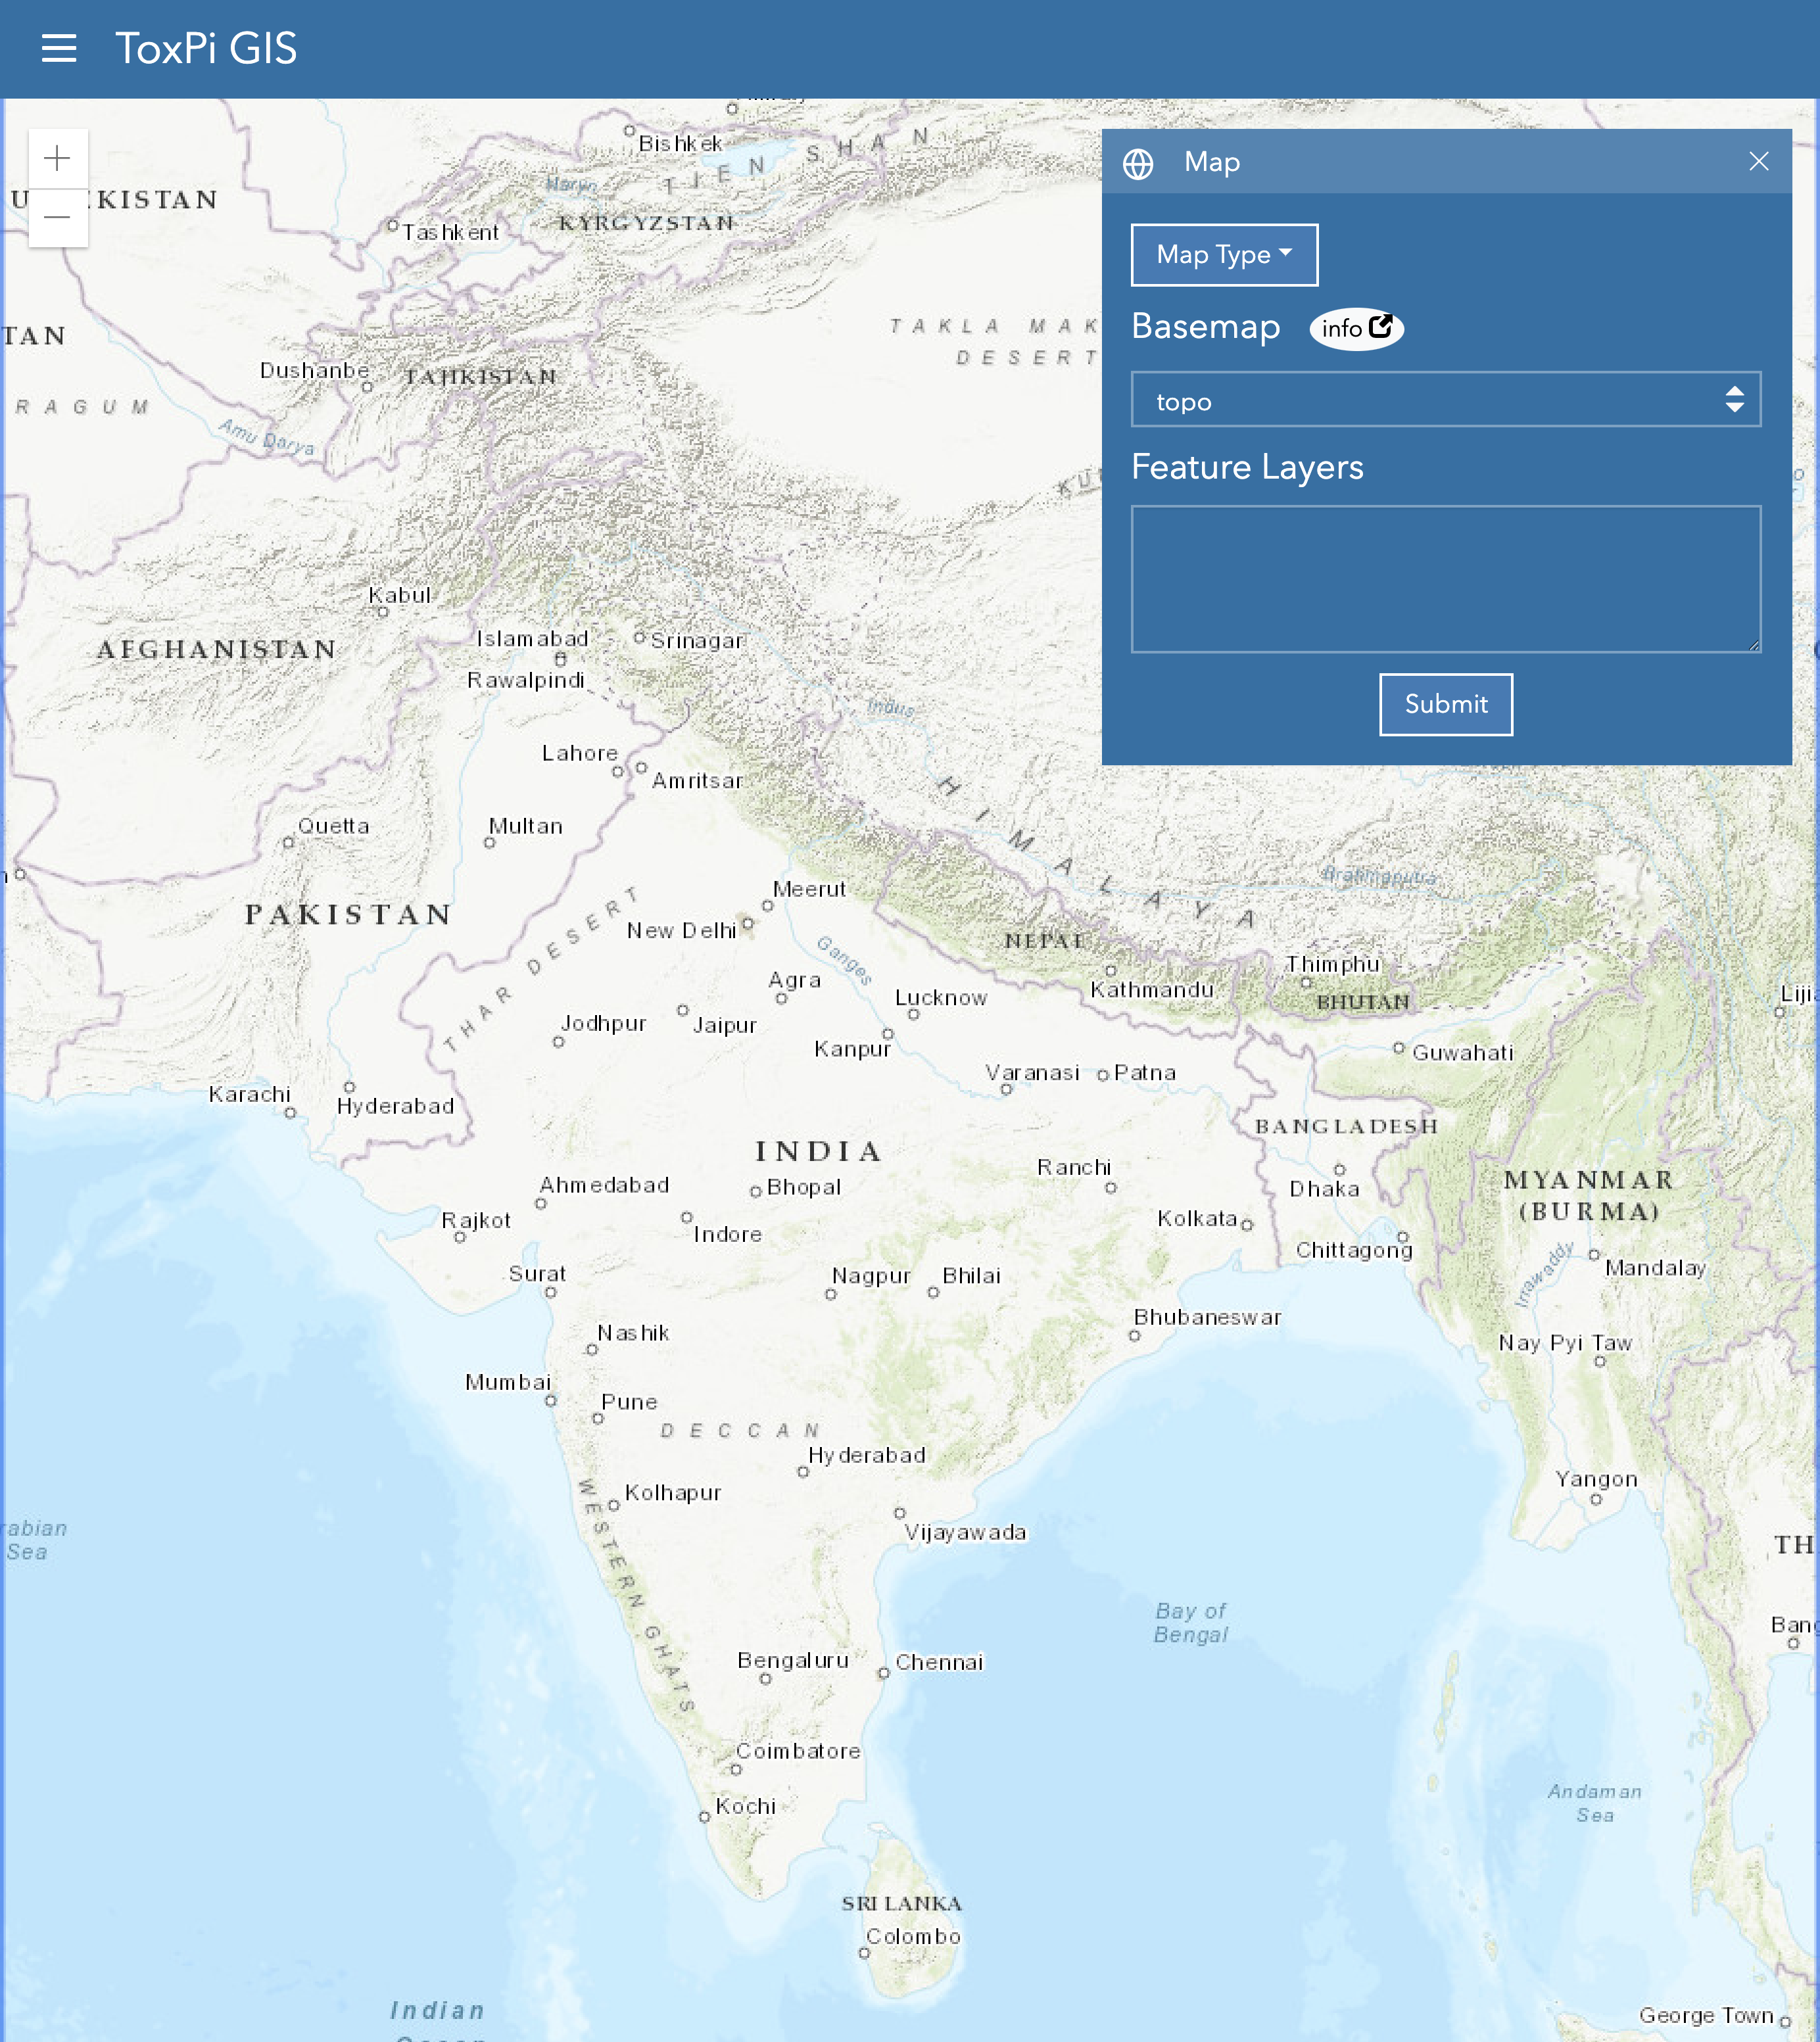
Choose map area
Interpreting ToxPi*GIS models
Overlay ToxPi*GIS model (CalEnviroScreen example)
This tutorial shows how an existing model (example from CalEnviroScreen) can be configured as a ToxPi*GIS layer.
To recreate this example, select 'Map' from the menu  at upper left. In the 'Map Type' selector, choose "WebMap PortalItem ID". Input the following PortalItem ID in the blank field: 0db22c1560b347508dec7873b97bd34a
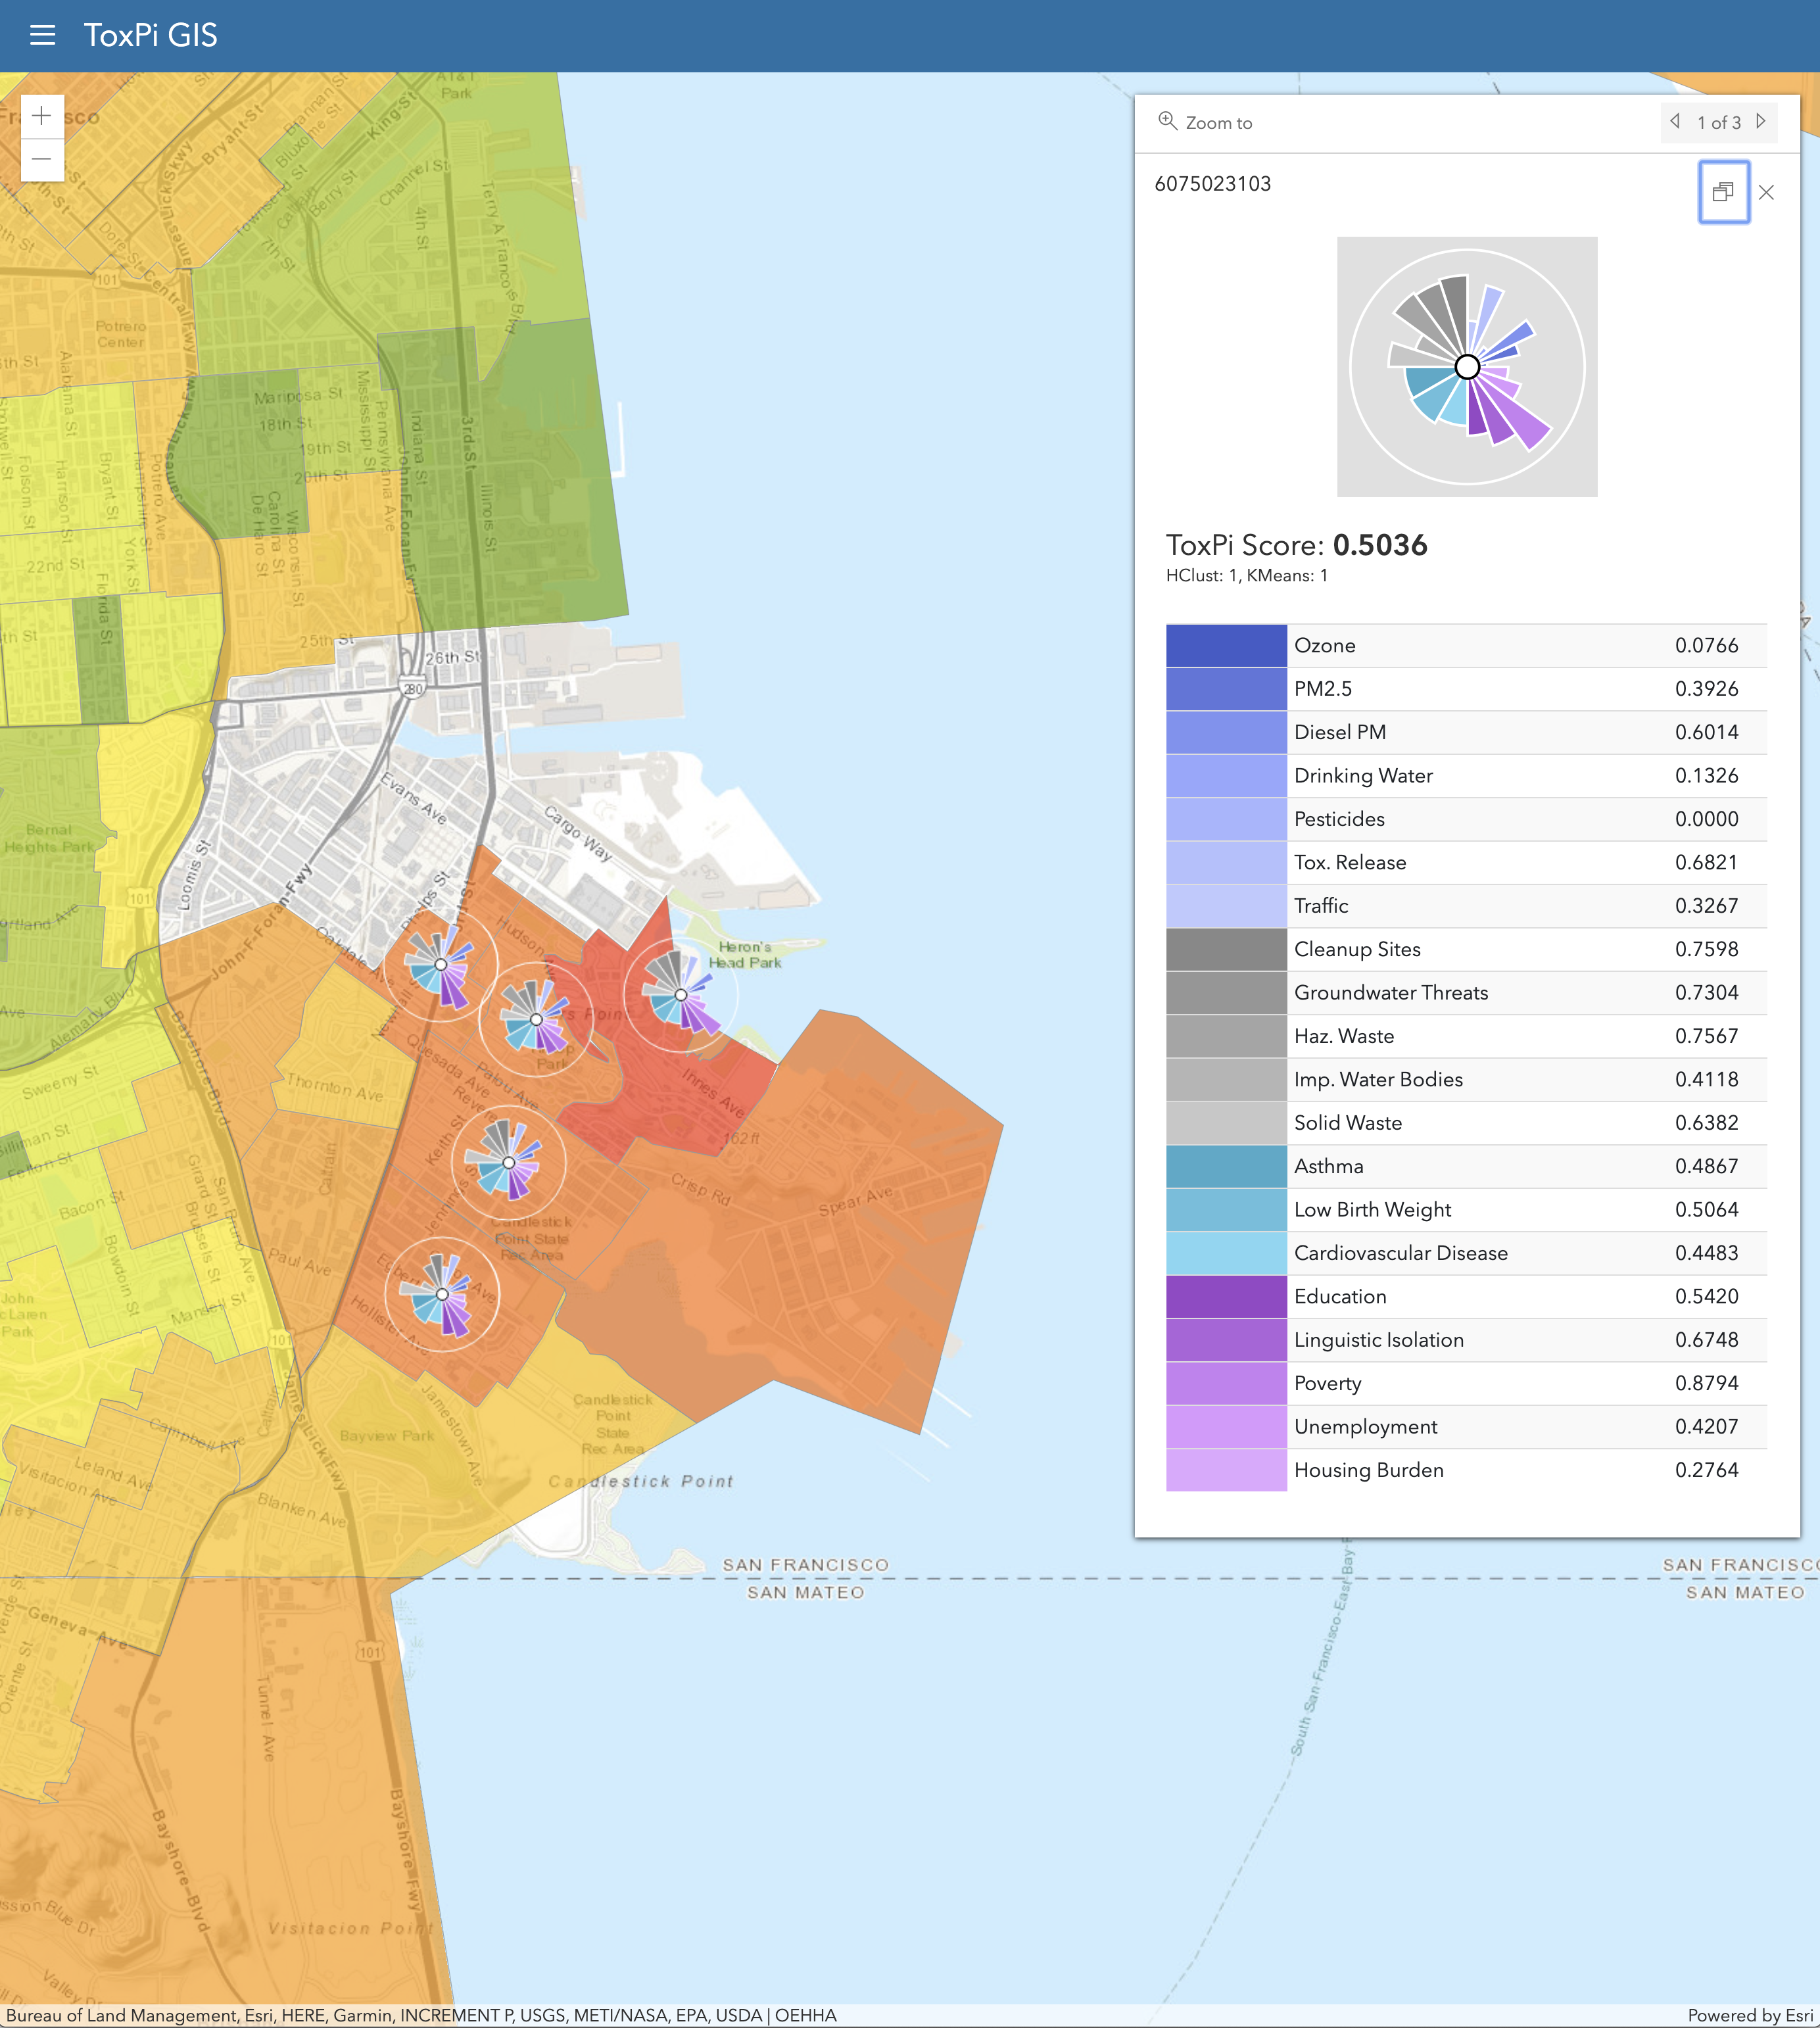
Next, select 'Upload' from the menu . Upload this example ToxPi*GIS model file (contains ToxPi results for the 1,000 highest-score census tracts from CalEnviroScreen data):
ExampleModel.csv
The default display shows only the top 10 results. To adjust the display criteria, select 'Filter' from the menu at upper left. Then click on any ToxPi profile to bring up a scorecard that summarizes score drivers.
Create custom ToxPi model
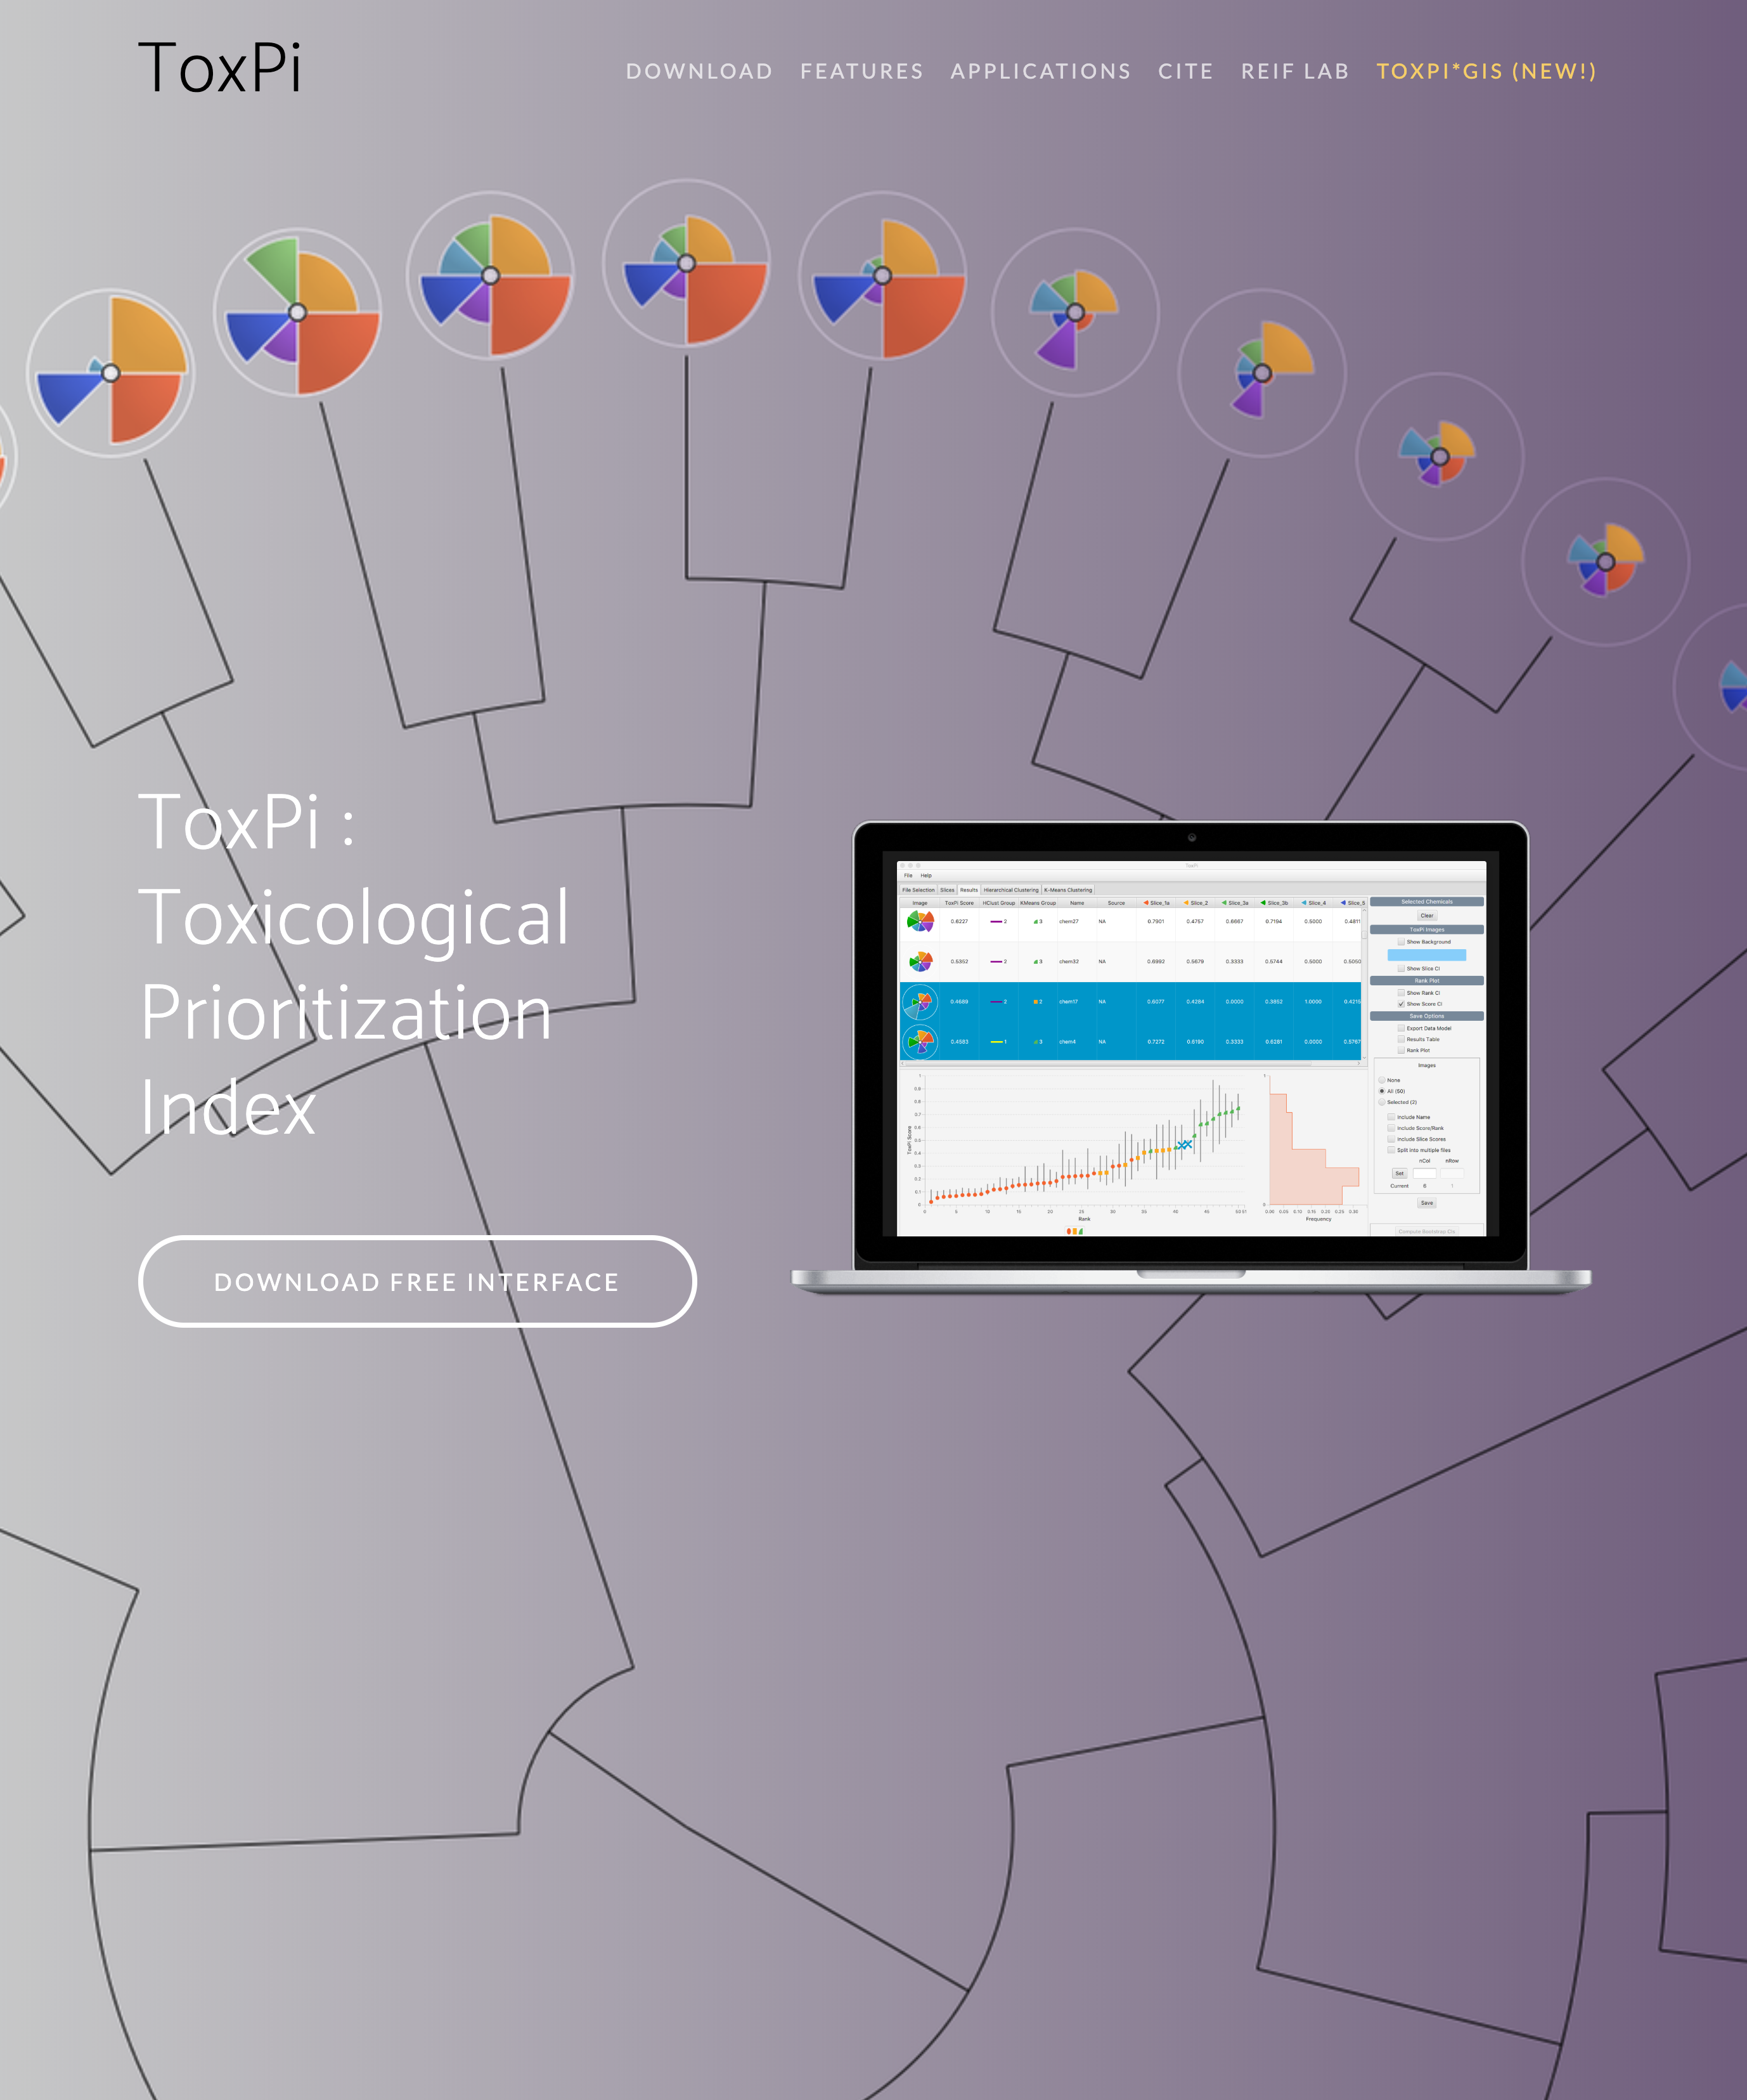
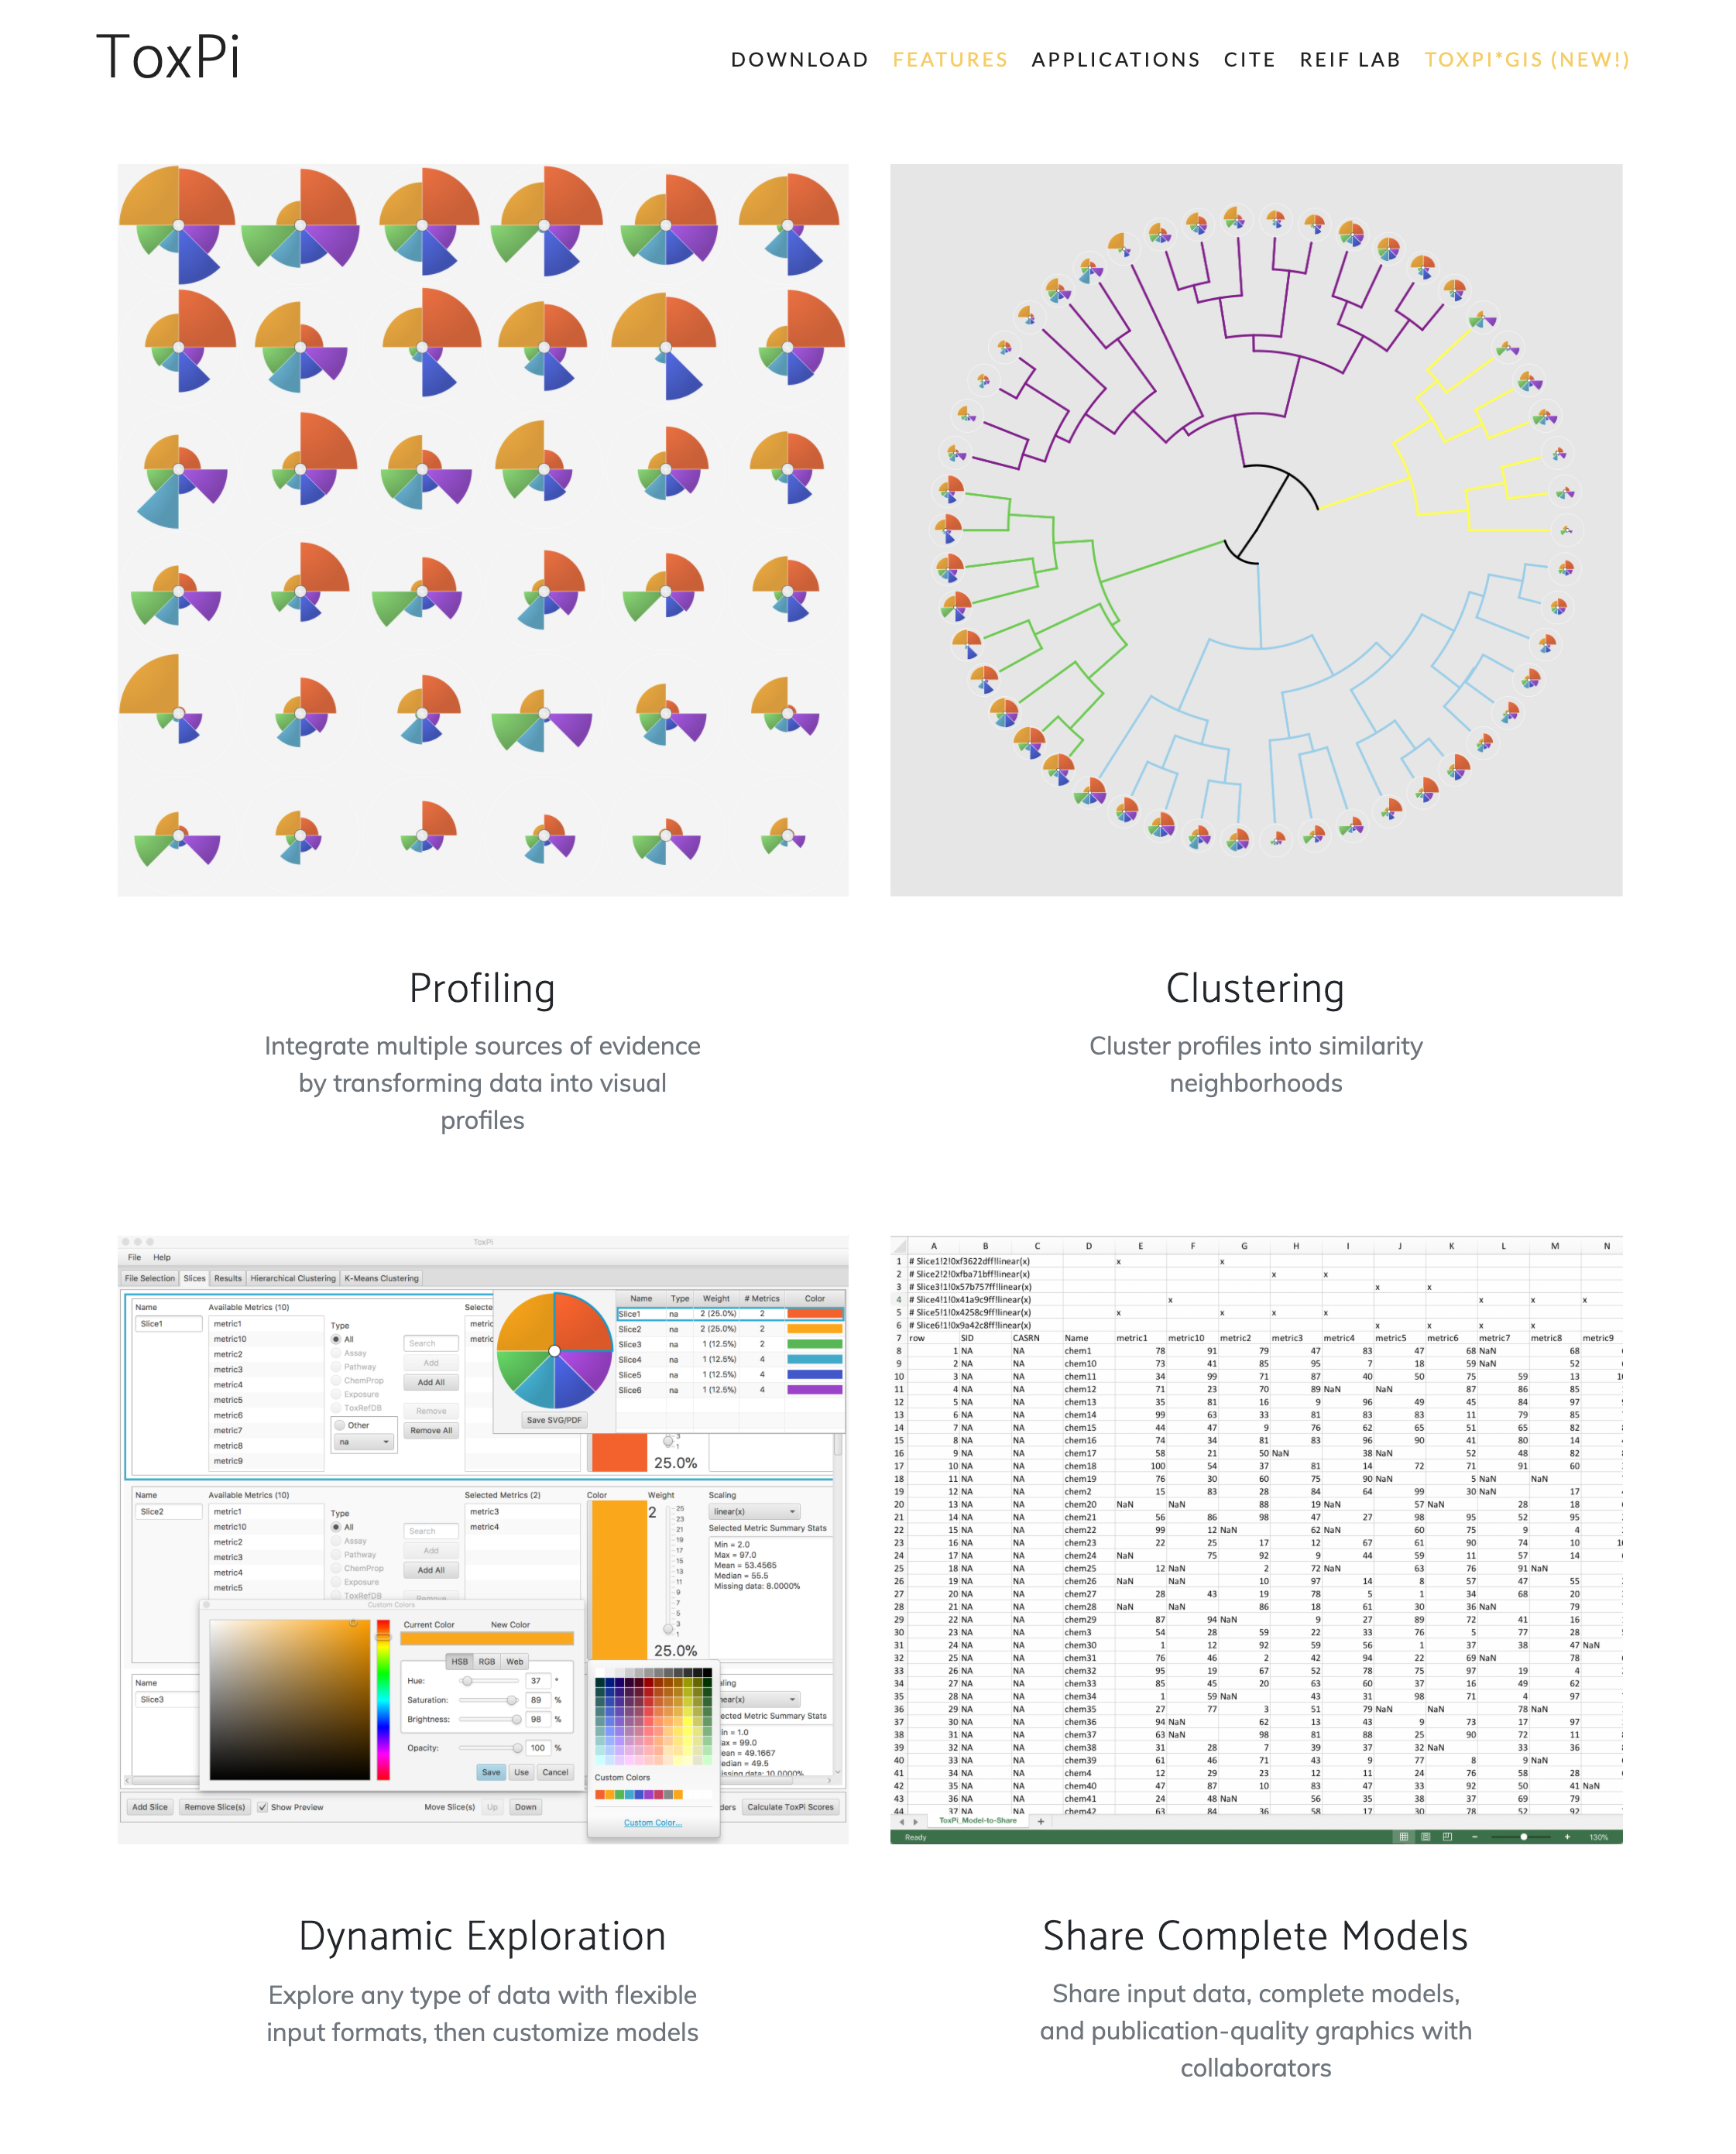
Software for creation, import, export, analysis, and sharing of ToxPi models is available for free at https://toxpi.org
Choose map area
From the 'Map' menu item, you can choose what kind of underlying map information to display. This can be a combination of 'Basemap', 'Portal Item ID', and/or 'Feature Layers'. The ToxPi profiles ('Layers') will be drawn atop whatever combination of 'Map' items are chosen.
Example of a 'topo' Basemap.
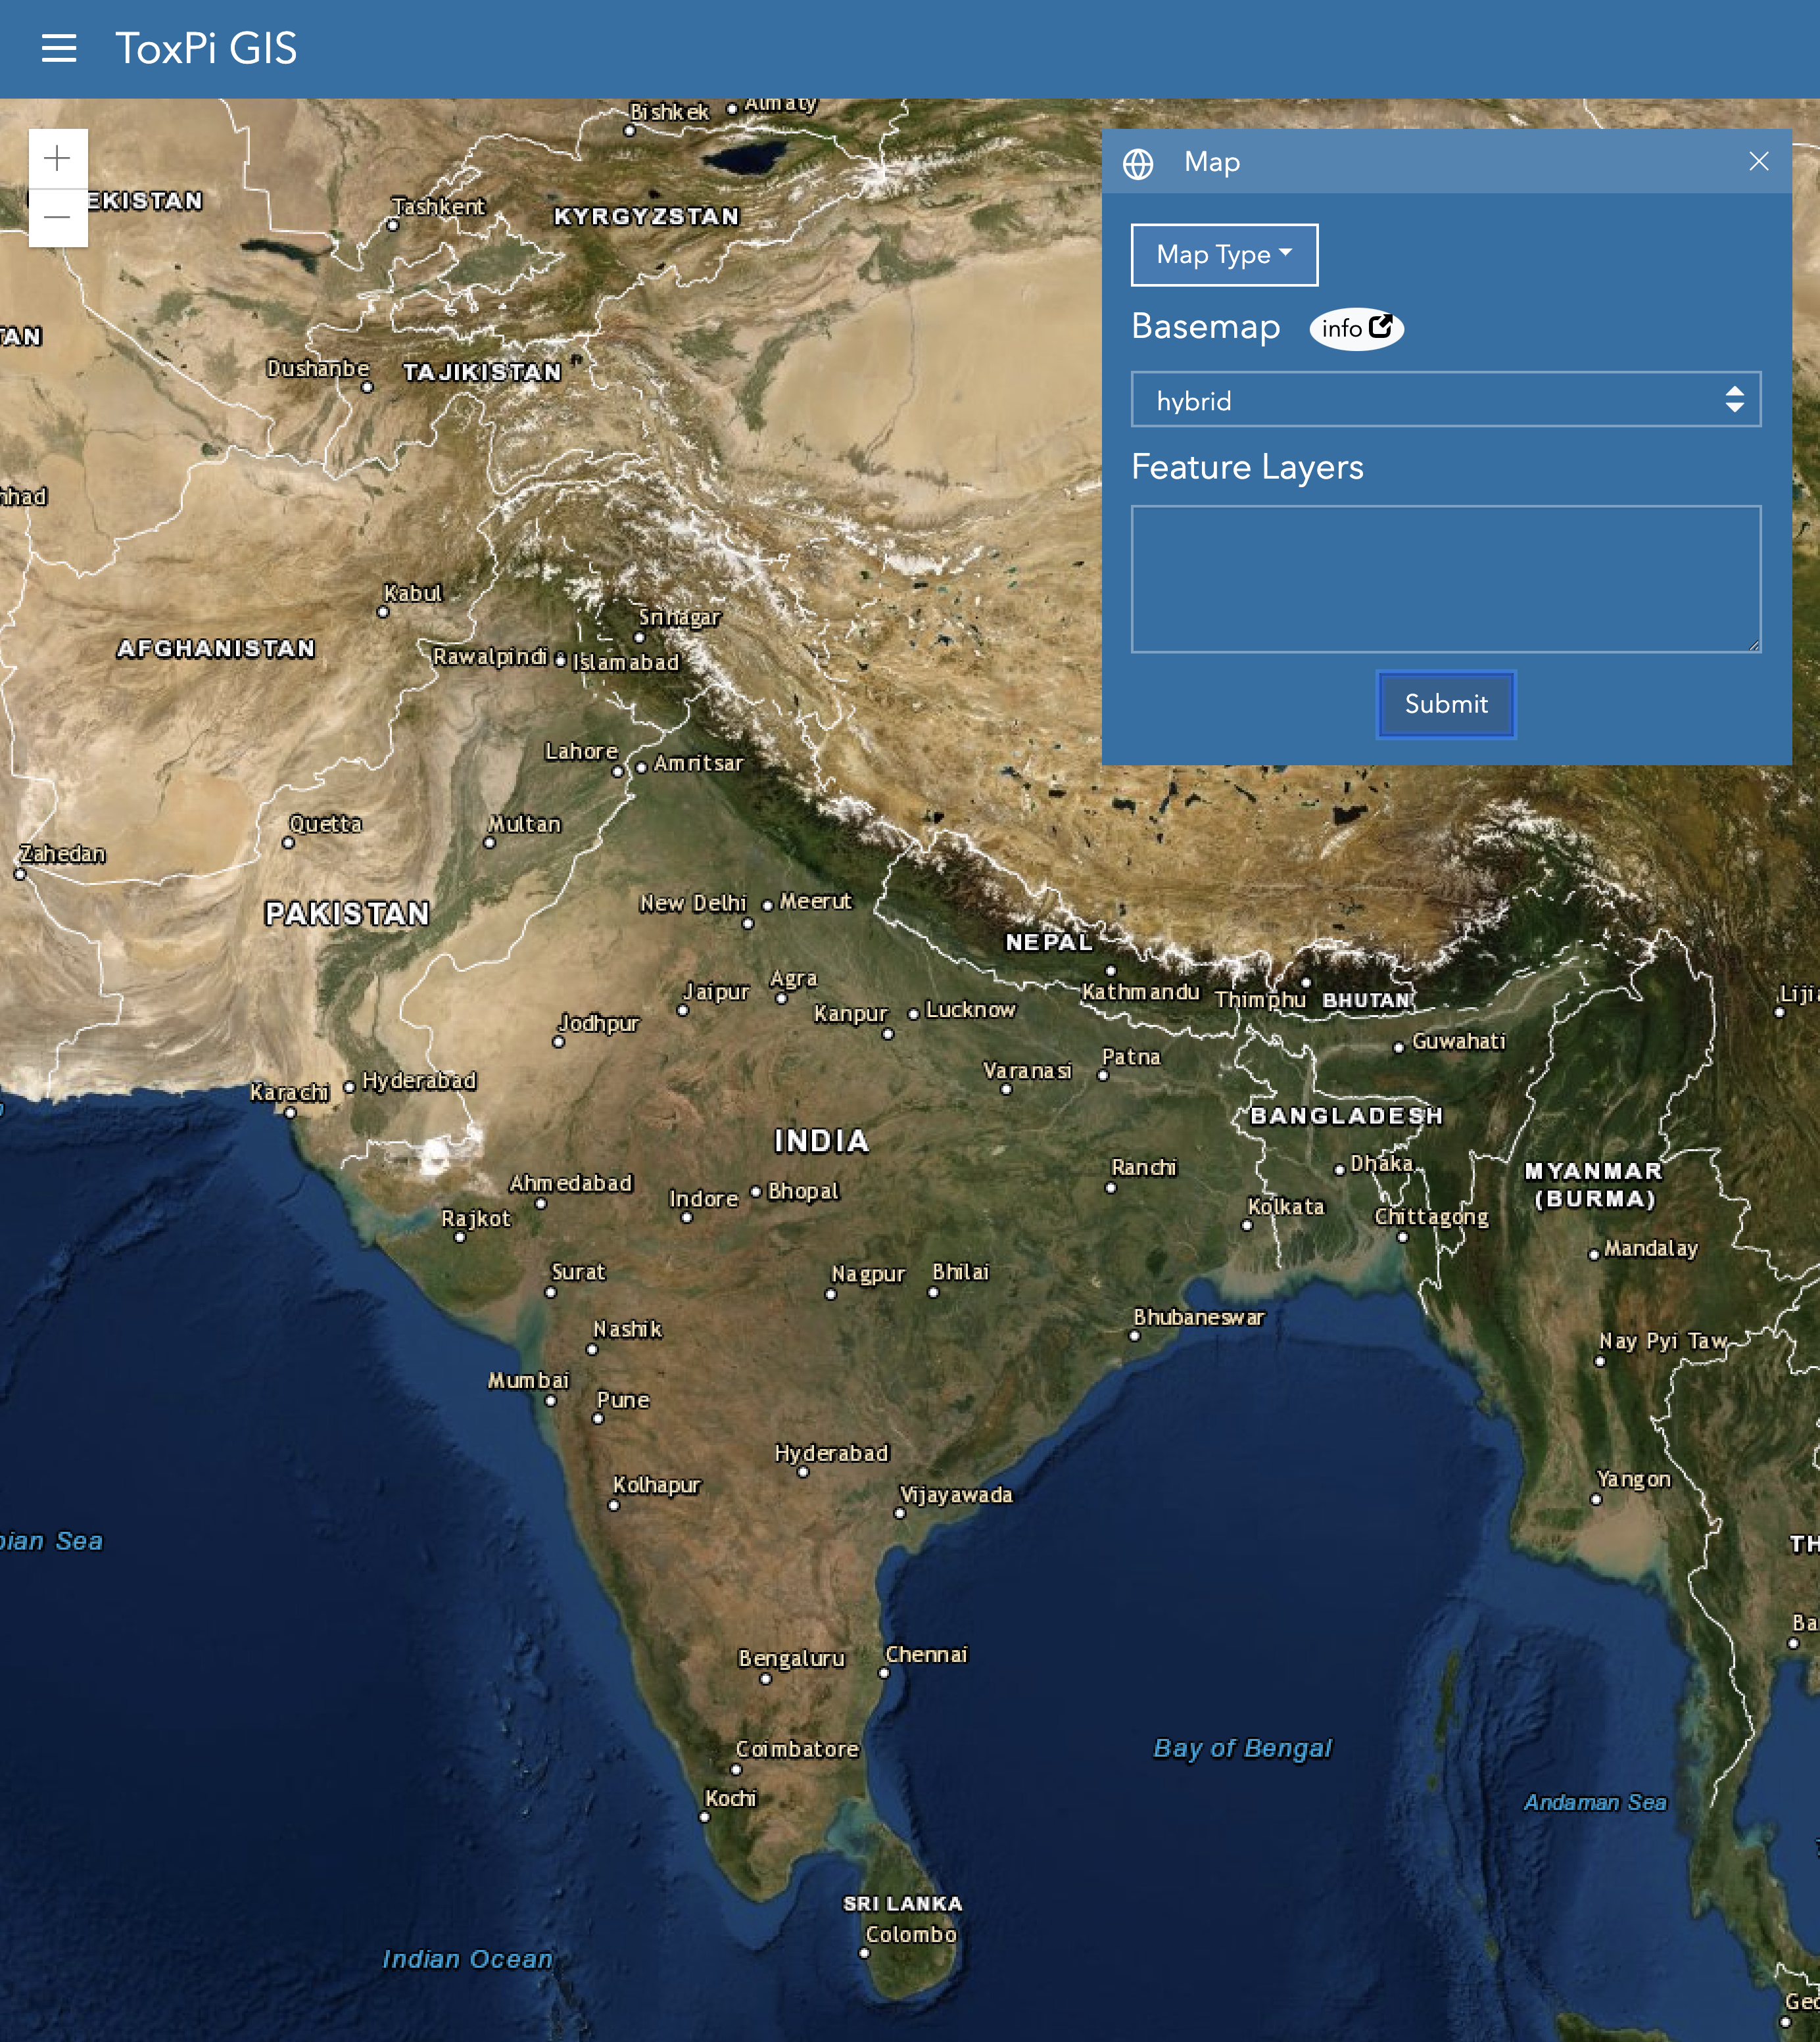
Example of a 'hybrid' Basemap.
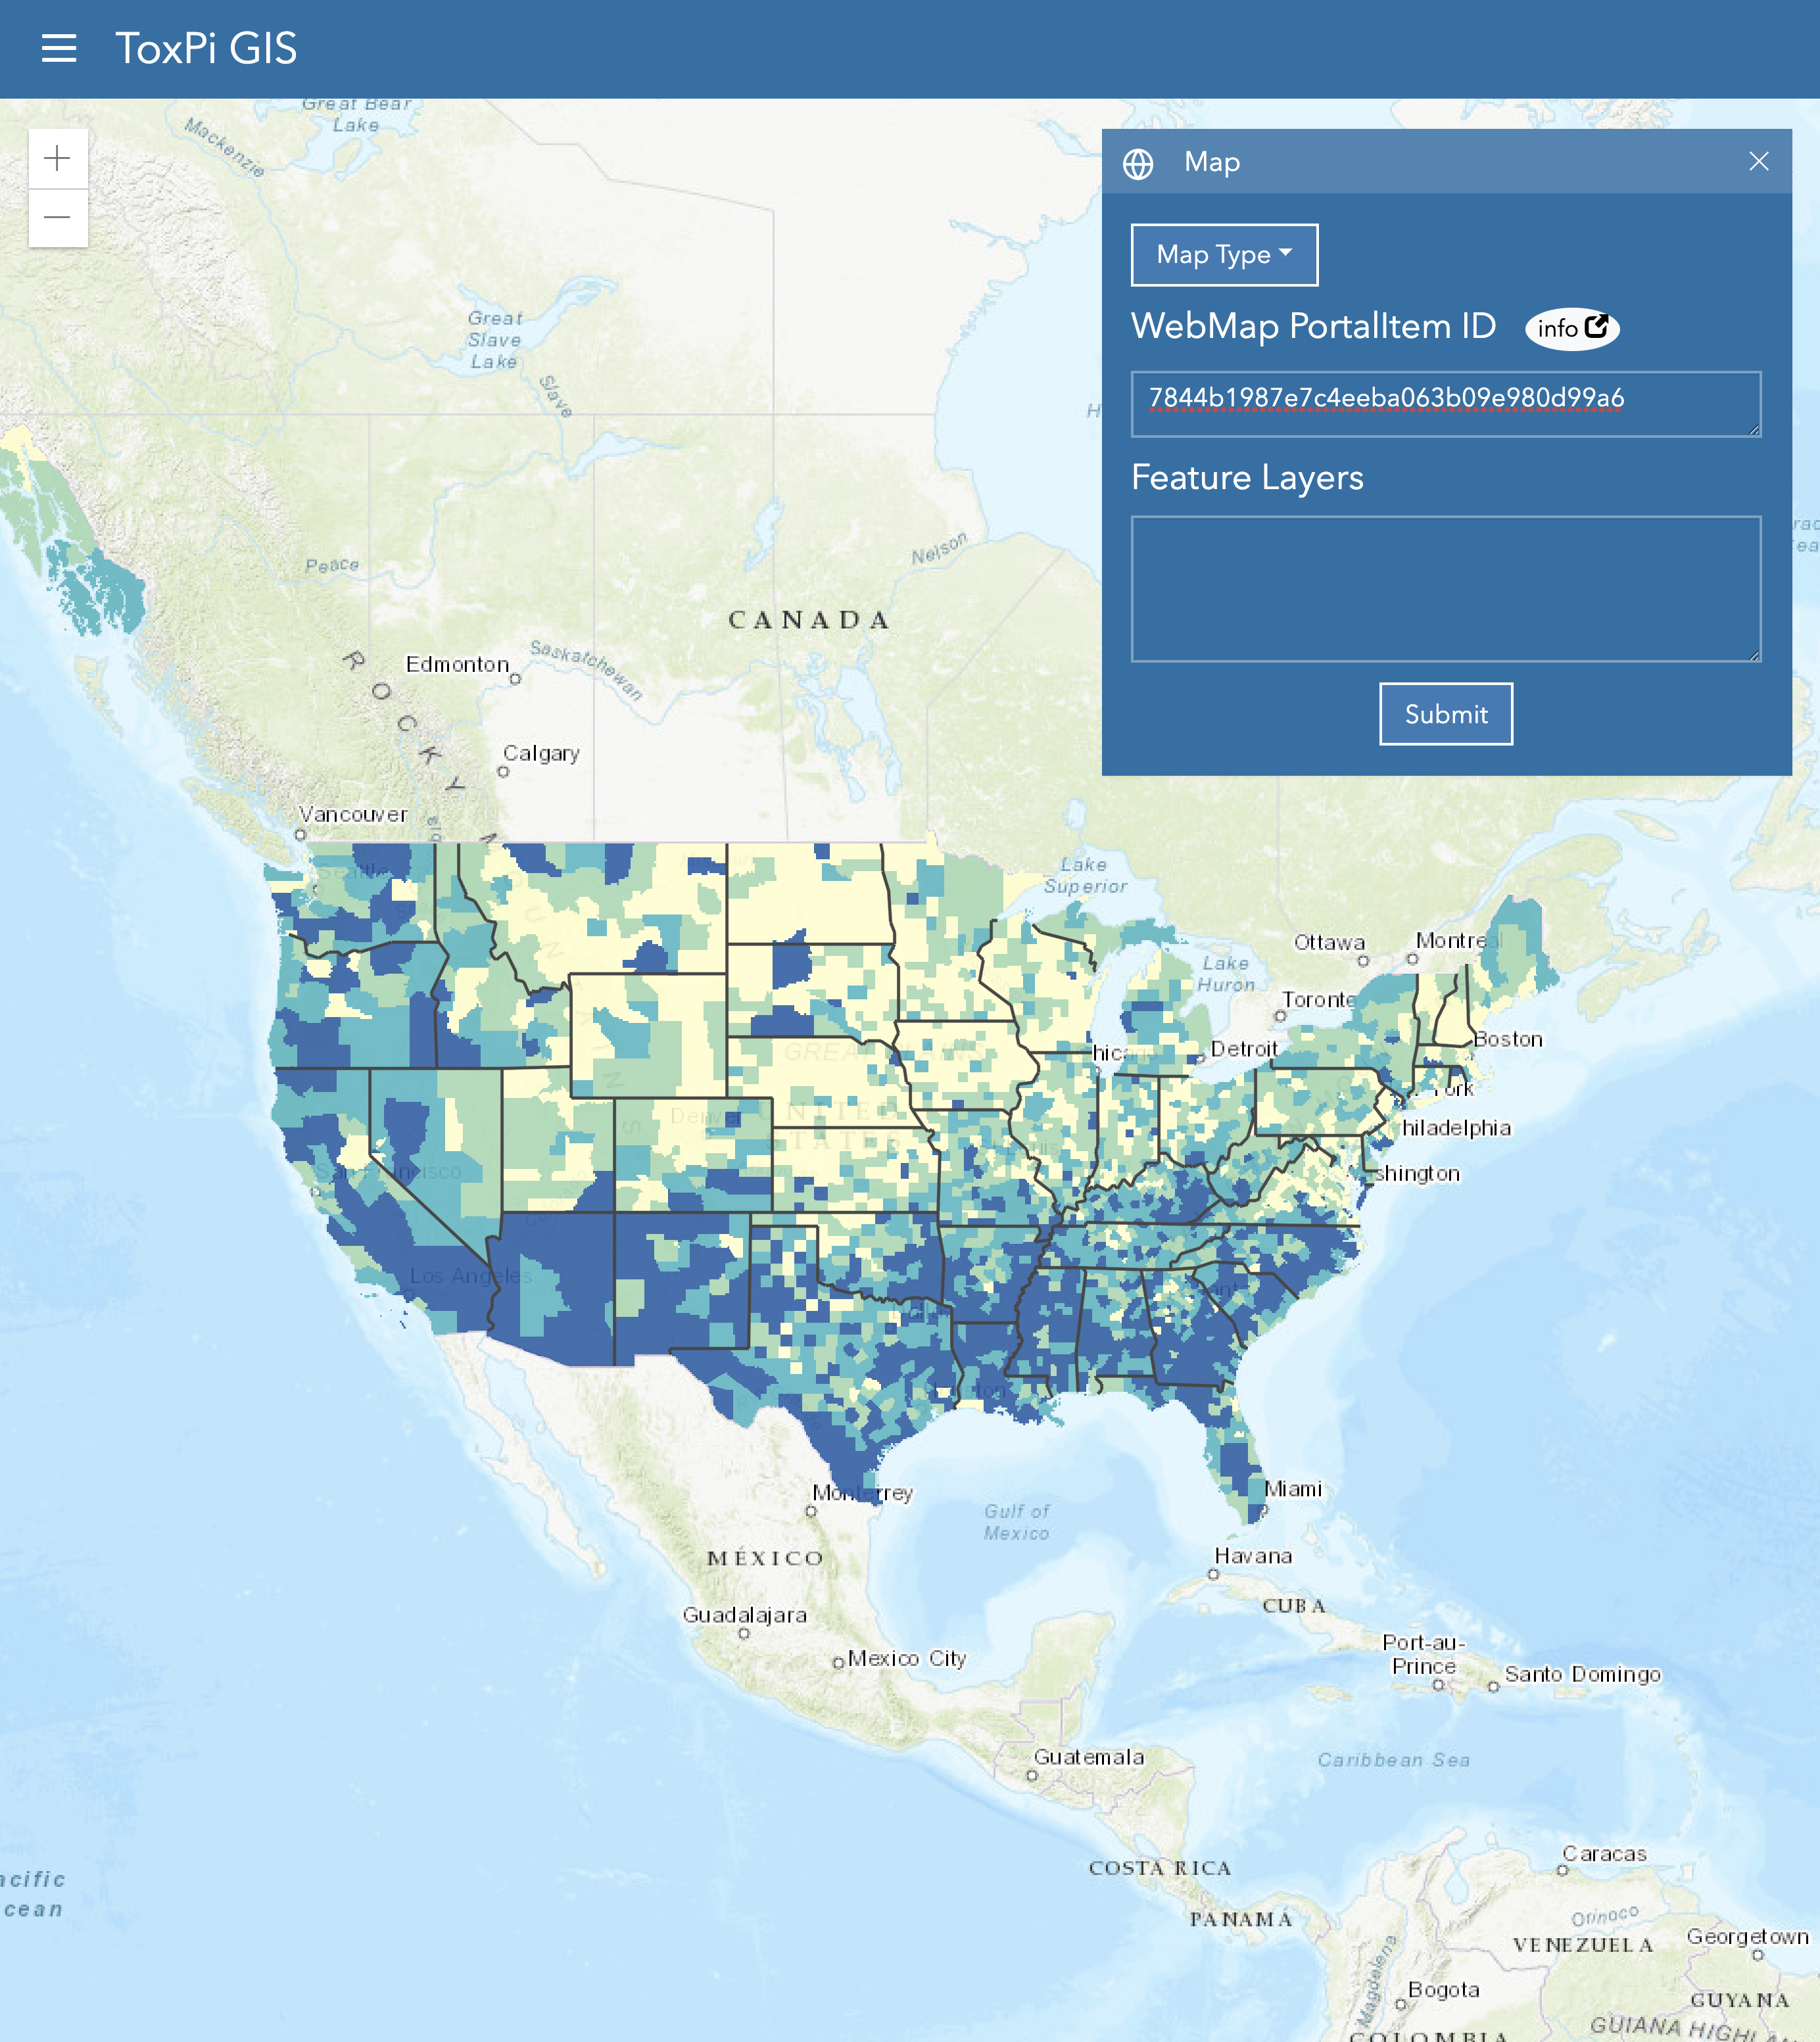
Example of a specific Portal Item ID. The Portal Item ID shown is the 2016 Social Vulnerability Index from the U.S. CDC.
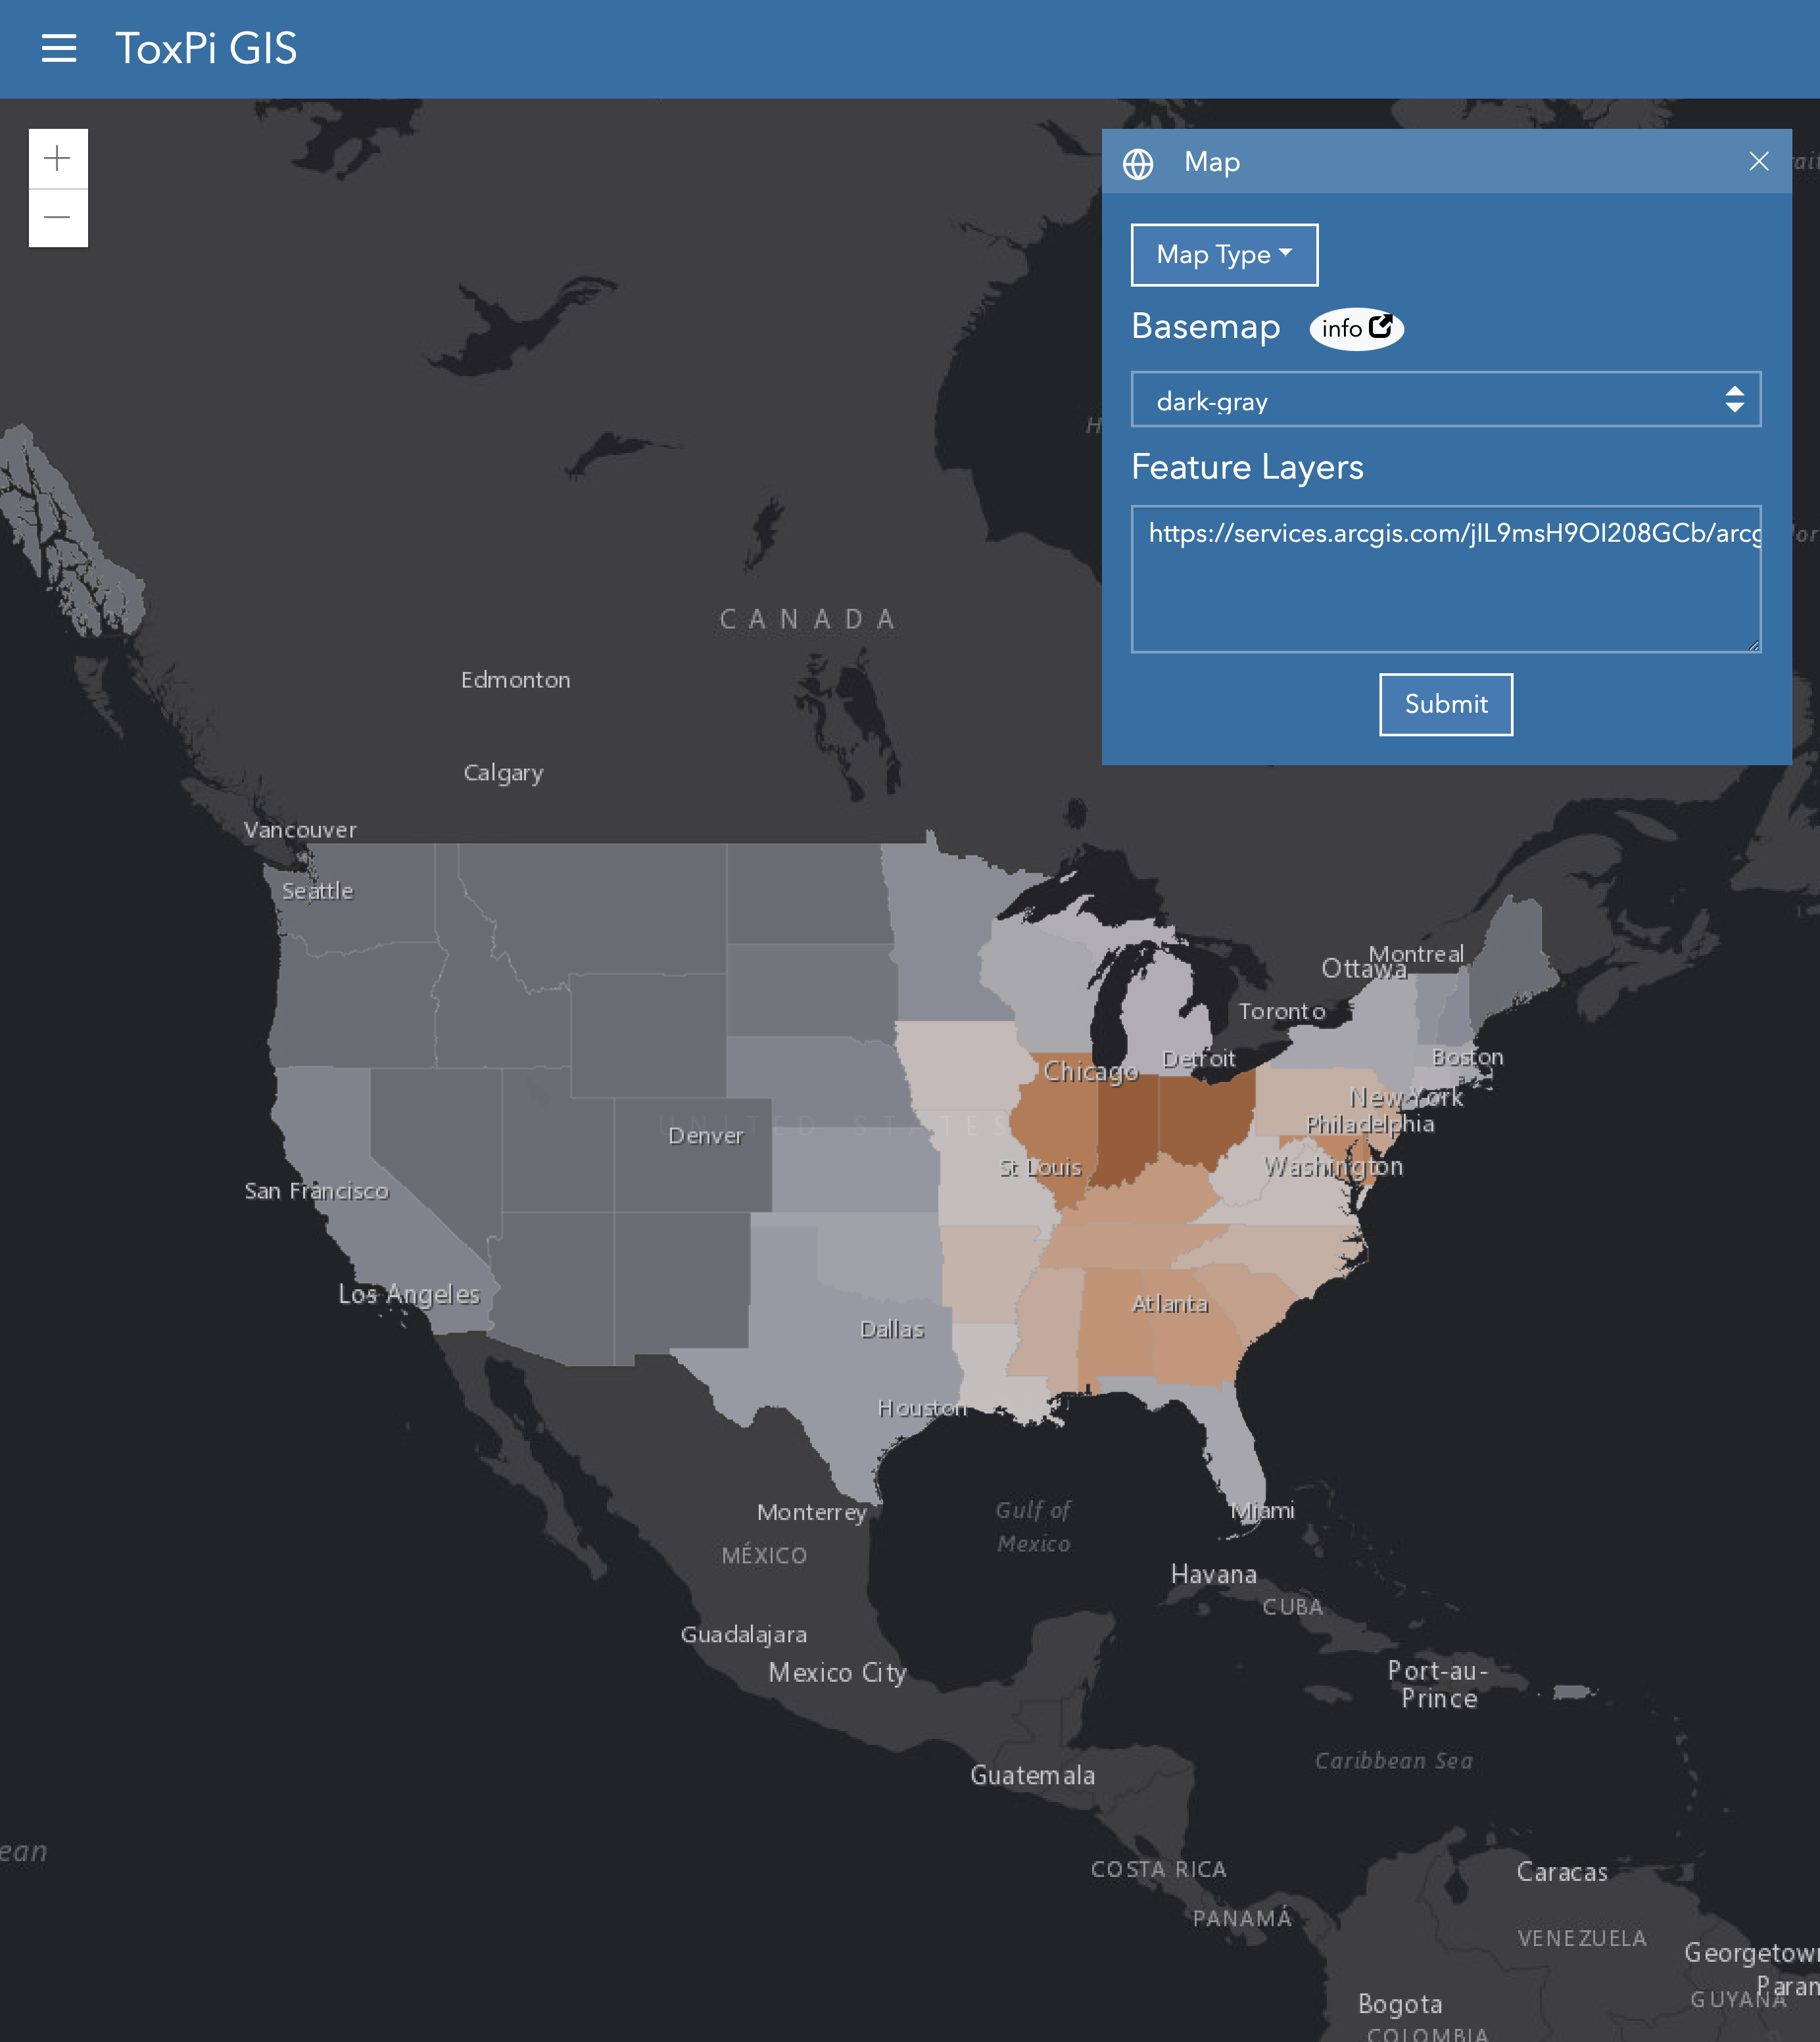
Example of a Feature Layer plotted atop a 'dark-gray' Basemap. The feature layer shown is USA Particulate Matter (PM) 2.5 between 1998-2016 from NASA. Feature Layers can be toggled on/off via the 'Layers' menu.
Interpreting ToxPi*GIS models
Data could come from environmental monitors, epidemiological surveys, health status, clinical data, socioeconomics, or any source that can be tied to an arbitrary geographic region (e.g. census tract, postal code, county, state, or country).
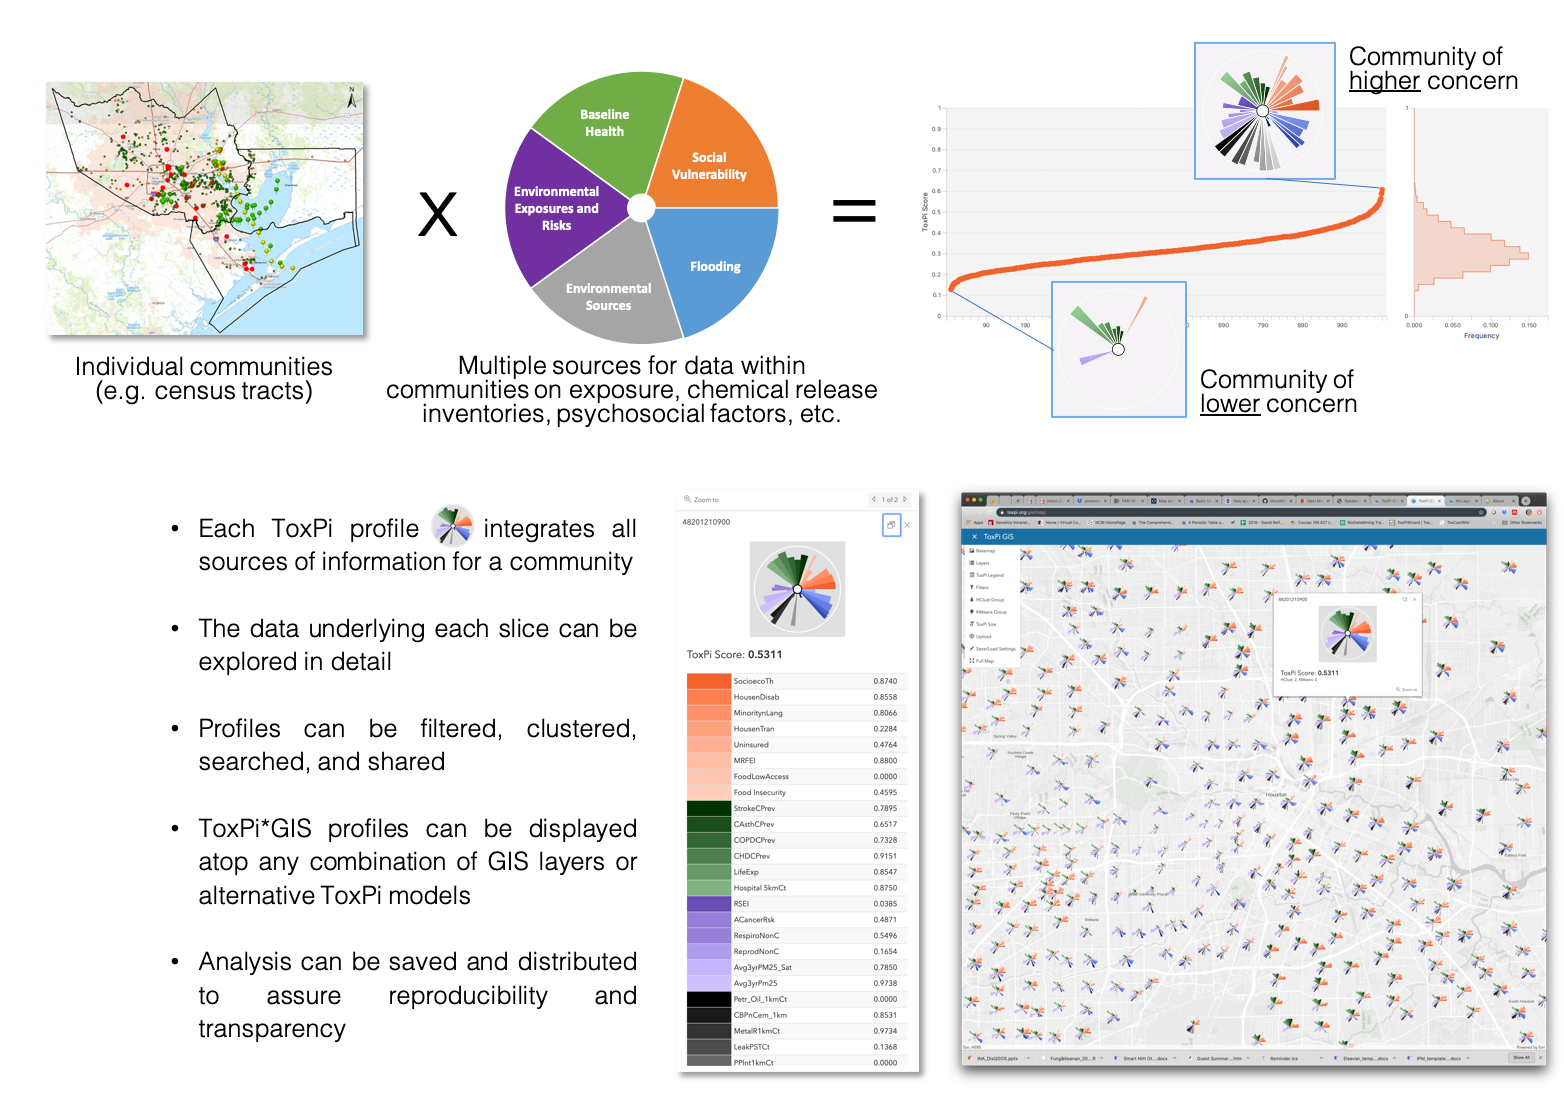
Example ToxPi*GIS application for HGBEnviroScreen.